Fair play thanks to GPS analysis (4/5)
How does the quality score system work?
Each trip submitted receives a quality score based on various measured variables - such as GPS stability, sampling rate, signal noise or speed fluctuations.
If this score is below a defined threshold, the activity is automatically removed from the ranking list and the participant is informed transparently as to why this has happened.
We have introduced three categories of notes so that we can classify potential problems clearly and comprehensibly: Notes, Flags and Warnings. They appear individually or in combination, result in an internal quality score and ensure transparency and fairness in the evaluation process.
👋 NOTE
A grade marks minor discrepancies that have no effect on the time measurement or occur so frequently that they are statistically insignificant - provided the rest of the data is clean.
They serve as a guide for the reviewers, but do not have to be checked manually.
Example: Elevation profile slightly shifted due to inaccurate barometer calibration.
⚠️ FLAG
A flag indicates problems that could influence the reliability of the time measurement and require a critical check.
Multiple flags usually mean that the ride is not permitted for the ranking.
Example: Extremely high speeds that would only be realistic for professionals.
⛔️ WARNING
A warning is the highest warning level and is issued if the integrity of the file is in question or the behaviour appears physically impossible.
Rides with a warning are rejected and the participant can complete the route again.
Examples: Impossibly high accelerations or average speeds, or a position frequency that is too low (more than one second per measuring point).
Why this is important
Our aim is for every driver to be able to understand how we ensure fairness and transparency - and at the same time minimize false-positive assessments.
Over 99% of all journeys pass our quality check without any restrictions. Only a small proportion are marked or excluded - and this is transparent, data-based and fair.
If you're interested in the technical details behind our digital doping detection and fair ranking algorithms, stay tuned: we'll be providing even deeper insights in upcoming posts.
Insights into our data analysis
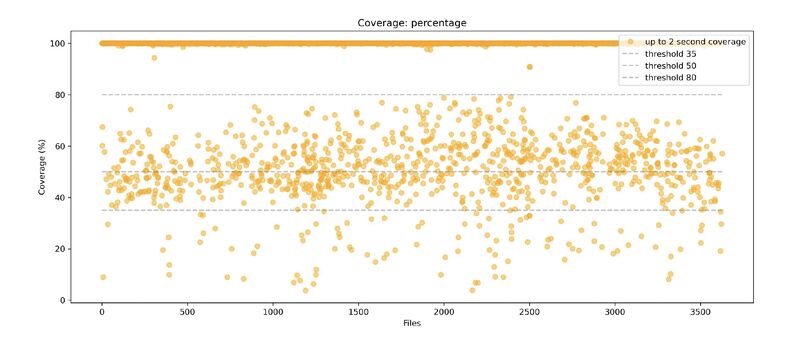
An overview of how often different GPS devices record position data - this shows the variety of data our algorithm works with.

A preview of the results of our quality checks: How many notes, flags and warnings occur in a typical LaceUp event - over 99% of the rides make it into the ranking.
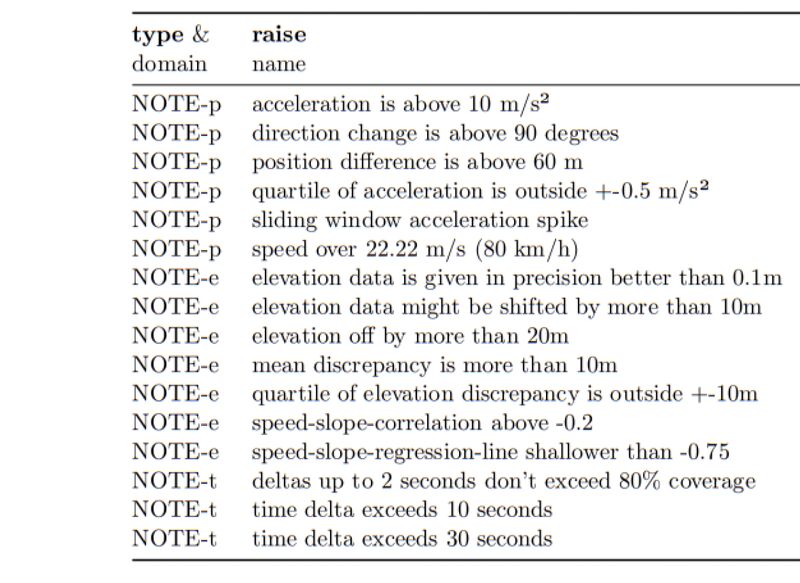
An insight into the factors we take into account for Notes. The exact variables for flags and warnings remain confidential to protect the integrity of our testing procedures.
Conclusion
Fairness in digital sport is not created by blind algorithms, but by transparent criteria and comprehensible communication.
With our approach, we ensure that every performance counts - honestly, comprehensibly and with technical precision.
Credits
Kevin KoschNikolaus RathBenedikt Soja, Matthias Aichinger-Rosenberger, Nico Schefer, Sebastian de Castelberg, Tobias W.